Insights
FourSight: Have We Peaked?
Valuations reach new heights

According to PitchBook Data, the number of deals closed in 2016 declined by 23% compared to 2015. But total deal value didn’t change significantly. So if fewer deals closed, but the same amount of money changed hands, that means buyers are paying more for companies.
This observation was affirmed by GF Data, which reports on private equity transactions valued between $10-250 million. Overall, middle market valuations averaged 6.9x in 2016 — a record high since 2003.
Whether these numbers represent a peak in the seller’s market — or a trend that will continue into 2017 — remains to be seen. But here’s what we do know…
DEAL FLOW SLOWED (A LITTLE)
GF Data tracks the activity of 206 private equity firms in the middle market. In Q4, those firms reported 52 transactions, bringing completed deal volume for the year to 209. This represents a decline from 235 in 2015, and it’s in line with higher-level market reports that showed a slowdown in activity over the course of the year.
QUALITY MATTERED
Companies with above-average financials not only garnered higher valuations in 2016 — they simply got deals done. Last year, 59% of closed transactions involved a sell-side company whose Trailing Twelve Months (TTM) EBITDA margins and revenue growth rates were both above 10% (or one above 12% and the other metric at least 8%). In other words: a company was more likely to sell if it performed well.
PLATFORMS REMAINED ON A PEDESTAL
Traditionally, platform companies have achieved higher valuations than add-on acquisitions. (As context: when a private equity group buys a company, it’s either a platform company or an “add-on” acquisition.)
From 2013 to 2015, we saw a new trend: there was virtually no difference in pricing between platforms and add-ons. But — if you remember from our fall 2016 report — the tides began to turn in Q2, and the gap continued to widen over the second half of the year. Overall, platforms traded at an average of 7.0x in 2016, while add-ons were valued at an average of 6.3x.
EQUITY CONTRIBUTION WAS ON THE RISE
While company valuations increased in 2016, debt levels remained flat — which explains why average equity contribution rose from 43.3% in 2015 to 45.4% in 2016, according to GF Data. In other words: to close deals in this competitive market, buyers are moving aggressively, but lenders aren’t.
Selling and Searching
Four major business categories — manufacturing, business services, healthcare services and distribution — comprise 80 percent of GF Data deal volume.
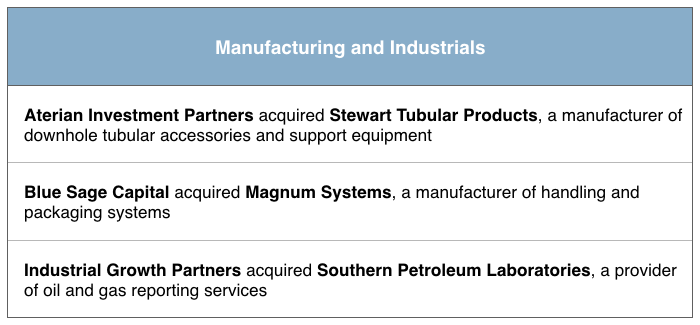
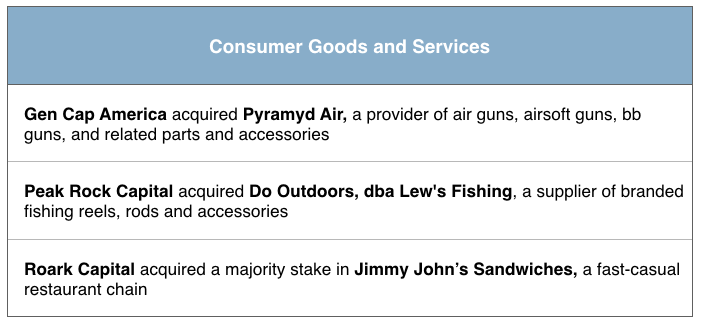
Here are a few deals completed by Private Equity Groups in 2016.
What kinds of companies are buyers looking for? Here are a few recent searches from Private Equity Groups.